Table of Contents
Queries, Charts and Reports
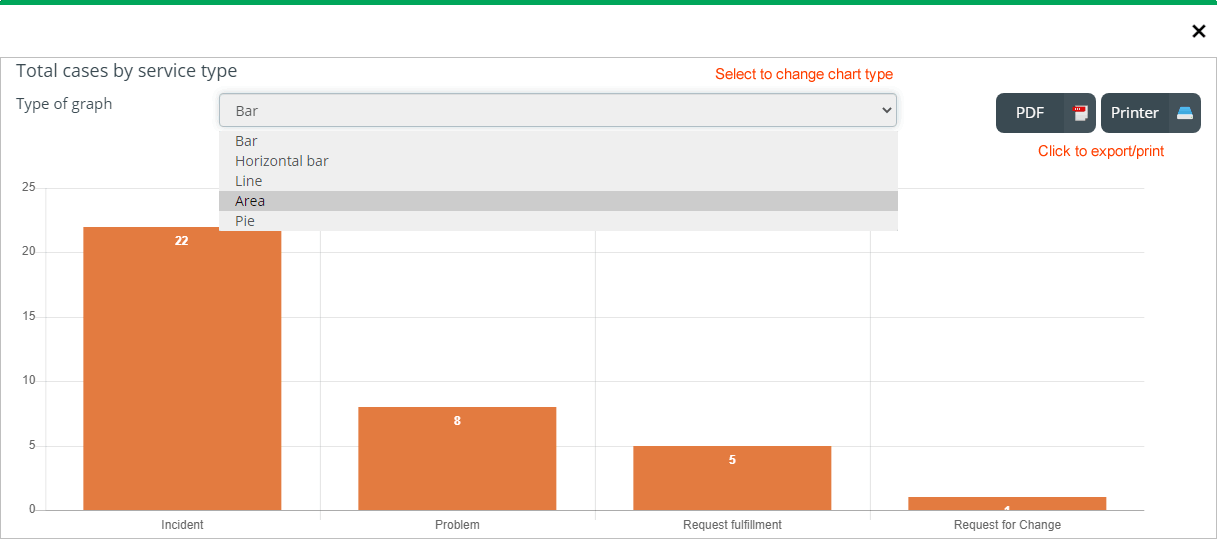
Administrators and managers have customizable queries, charts and reports available in their consoles to help them evaluate service trends: CIs with more reported issues, incidents, problems, requests, how many cases are closed or in progress, etc.
IT Help Center gives you the posibility to create and design as many custom reports as needed.
- Login to the ITHelpCenter1) portal with the user assigned by the ITHC2) administrator.
- In the menu on the left select the option to display a query, a query may have configured charts or reports.
Queries

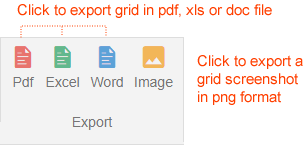
To export grid, use Export tools:

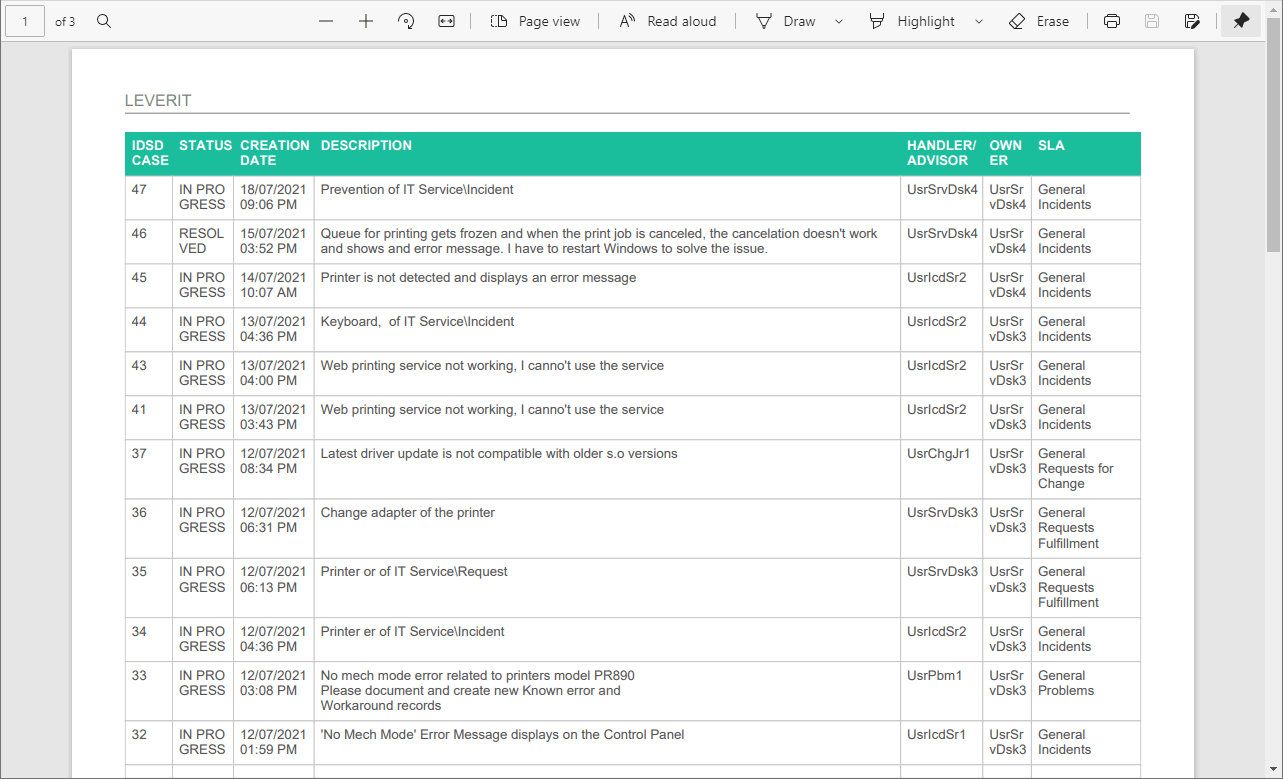
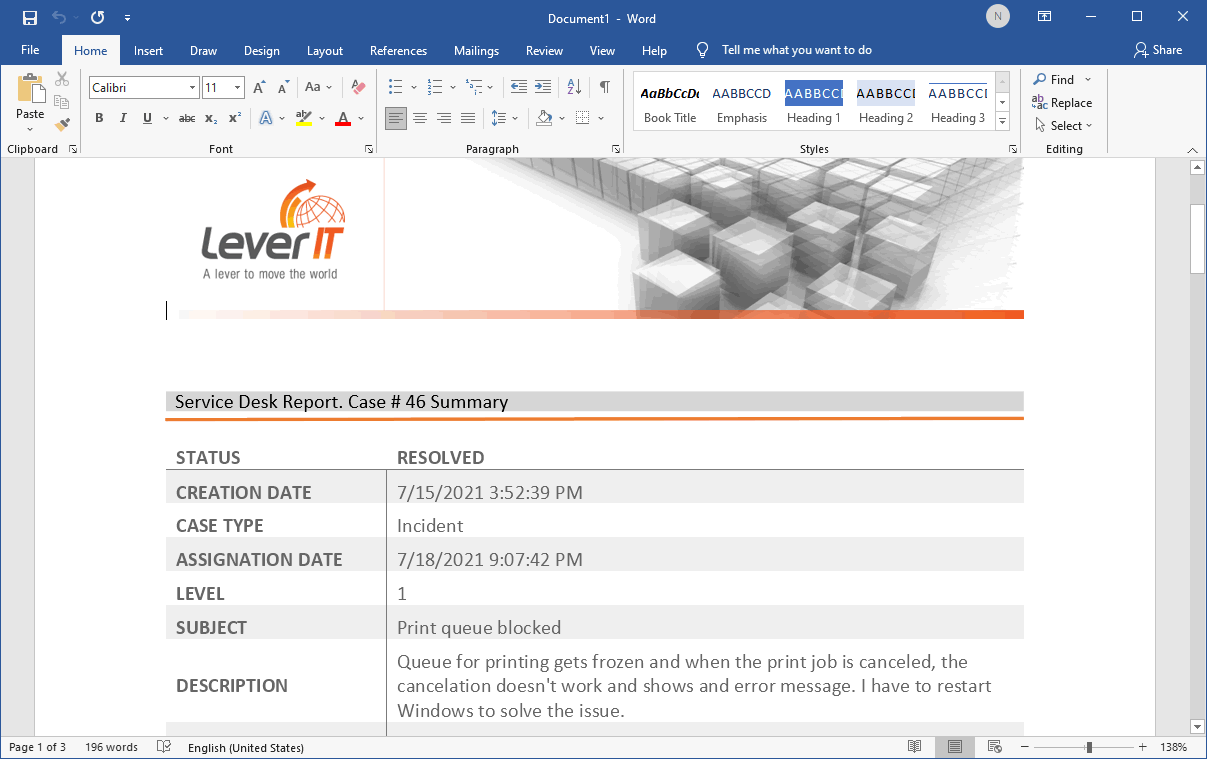
With Pdf and Word tools, the window to select columns and format will open, click on Download to export:


